

CloviCharts
AI-powered charts and data visualization — from data to insight in seconds
The global business intelligence market is valued at $26.9B (2024) and growing 9.8% CAGR, but the 'chart generation API' sub-segment ($2.6B TAM) is fragmented between heavy client-side libraries, generic watermarked image APIs, and overkill BI platforms. CloviCharts captures the underserved 8–12% of that market — SaaS developers and analysts who need production-ready, AI-explained charts without bundling dependencies or paying per-seat BI pricing — backed by 98 internal CloviTek use cases and a realistic 3-year SOM of $840K ARR.
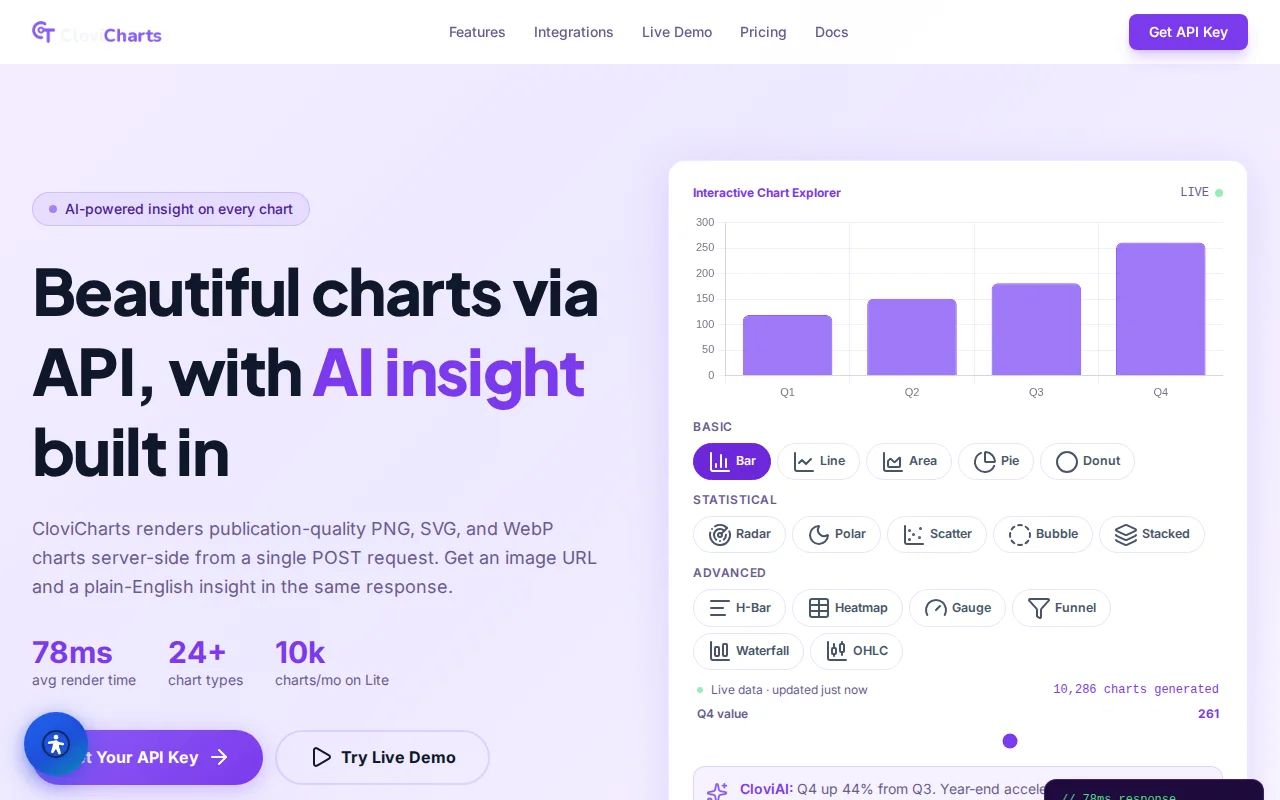
An overview of CloviCharts
CloviCharts turns raw data into production-ready, AI-annotated chart images in one API call. It eliminates the need to bundle chart libraries in multiple services, standardizes visual styling across products, and automatically generates one-sentence AI insights explaining what the data means — server-side, in under 400ms.
Where CloviCharts plays
Market scale
- TAM$2.6B
- SAM8–12% of segment
- SOM · base Y3$840K ARR (Y3, base — stated)
TAM = total addressable · SAM = serviceable addressable · SOM = serviceable obtainable (modeled base-Y3 ARR). Market sizes are third-party estimates.
Modeled opportunity · base Y3
Modeled 3-year ARR
Primary buyer: SaaS developers & analysts needing production-ready AI-explained charts without per-seat BI pricing
- Base SOM $840K = the figure already stated in market angle (anchor)
- 98 internal CloviTek use cases seed dogfood demand + API adoption
- BI market $26.9B 2024, 9.8% CAGR; chart-gen sub-segment $2.6B
Modeled estimate · pre-revenue · not a forecast of actual results. Forward figures are modeled estimates for a pre-revenue company — not booked revenue or a guarantee. TAM/SAM/SOM are market-sizing estimates; ARR is projected bottom-up from listed prices.
Built to win, not to blend in
AI narrative annotation — CloviAI…
AI narrative annotation — CloviAI Vision Engine generates a one-sentence insight for every chart, solving the problem that 67% of chart consumers spend more time figuring out what data means than making decisions
Key features
From start to result in 4 steps
Paste a CSV, upload a spreadsheet, connect a live data source via the API, or type data directly. CloviCharts accepts raw numbers and auto-detects structure.
Pick from 25+ chart types — bar, line, pie, scatter, heatmap, funnel, Gantt, and more. CloviCharts recommends the best visualization for your data shape automatically.
Apply your brand colors, adjust labels and axes, add annotations and trend lines. Every visual element is customizable through a point-and-click editor — no code required.
Download as PNG, SVG, or PDF, or copy an embed snippet for your website, report, or CloviDecks presentation. Live-connected charts update automatically when underlying data changes.
That's the complete CloviCharts loop — no manual steps, no tab-switching.
CloviCharts vs the alternatives
| Feature | CloviCharts | Alternative A | Alternative B |
|---|---|---|---|
| 25+ chart types with AI-recommended selection | |||
| Live API-connected auto-updating charts | |||
| Direct integration with CloviDecks presentations | |||
| Embeddable charts with responsive rendering | |||
| Full brand color and typography customization |
Comparison based on publicly available plans and features as of 2026. Competitor info may change.
Common questions about CloviCharts
CloviCharts accepts CSV/Excel uploads, direct data entry, and API-connected live sources. Enterprise plans support webhook-driven real-time updates so charts refresh as your data changes.
A glimpse of CloviCharts
CloviCharts ships as a fully branded, production-grade product on the CloviTek AI platform — integrated auth, billing, and a polished interface your team and customers can use from day one.
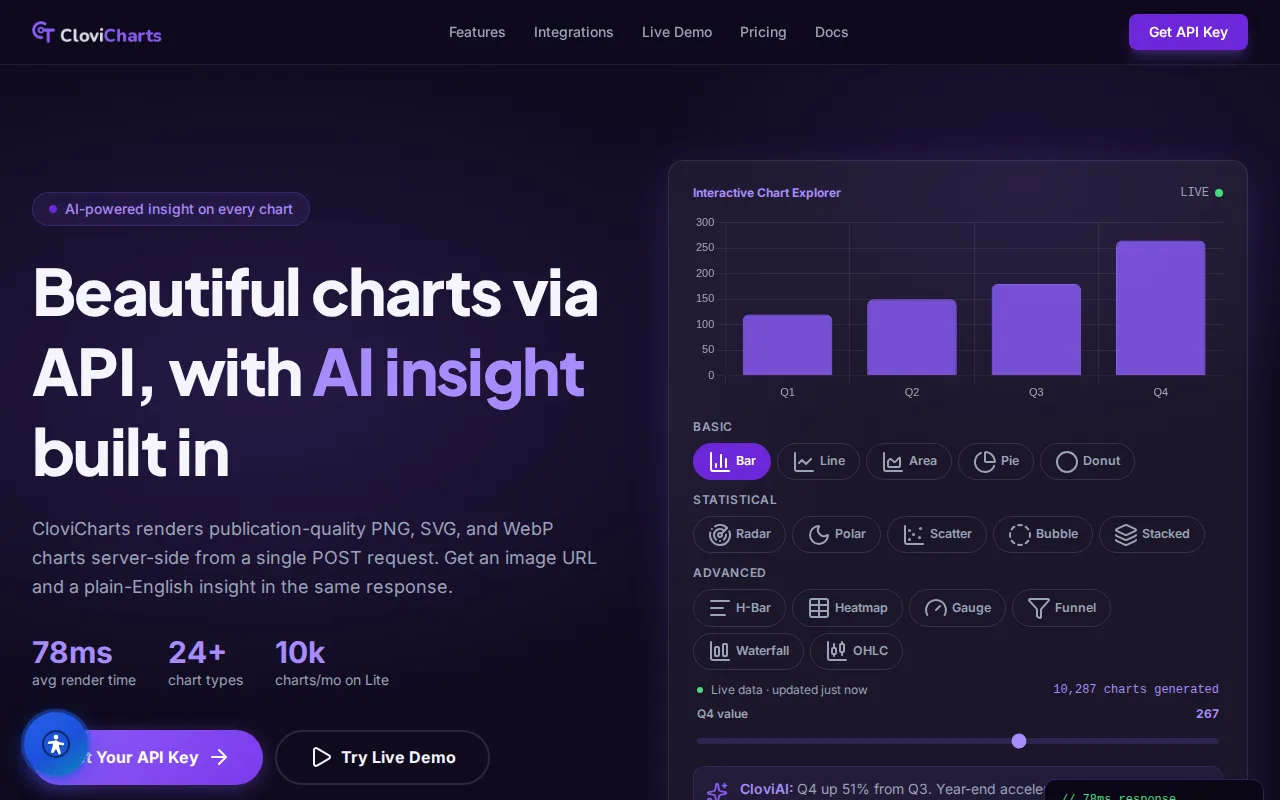
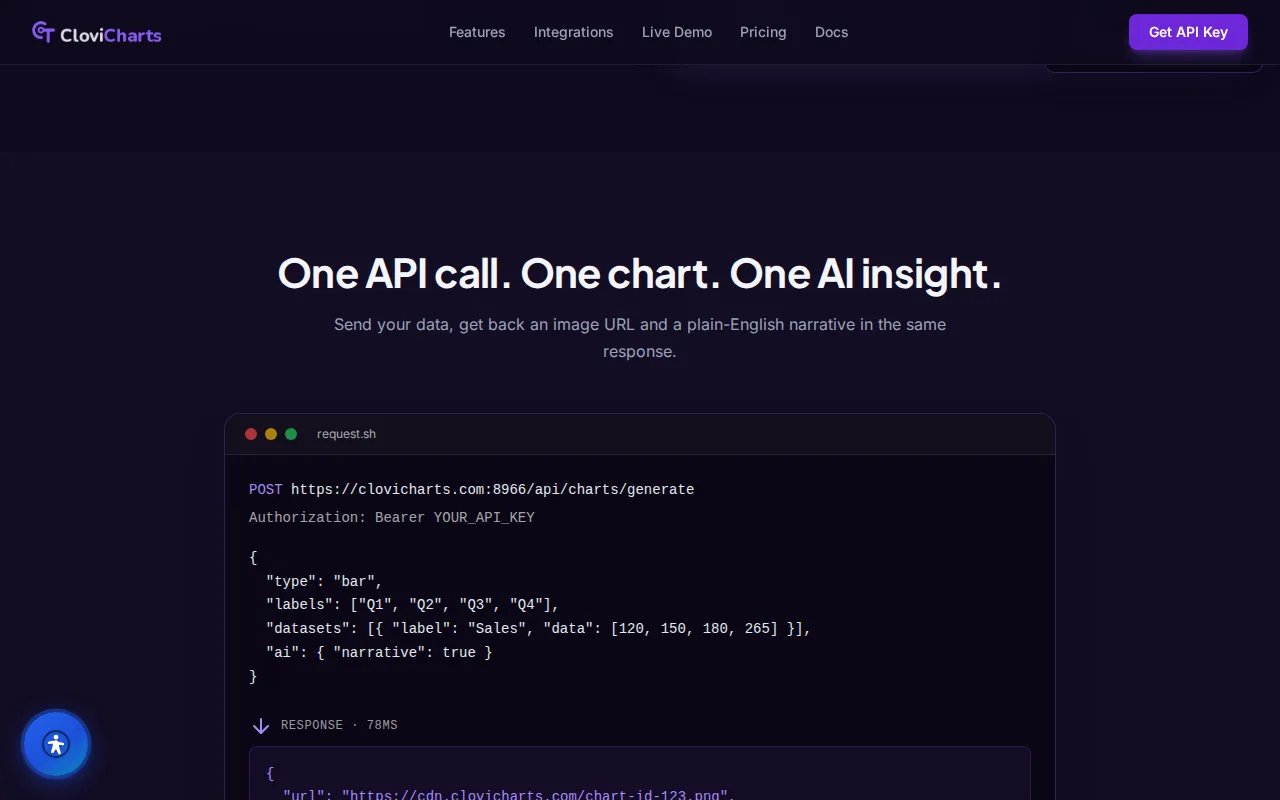
Real screenshots — no mockups
What you see is what you get. Every screenshot below is from the live CloviCharts product.
The founder’s journey
Why CloviCharts exists
CloviCharts was built for CloviTek's own operation first — and only became a product once it had done real work for the fleet.
CloviCharts is one of 0 platforms in the CloviTek fleet — every one designed, built, and operated by the same AI-powered engine that CloviTek runs its own business on. "AI-powered charts and data visualization — from data to insight in seconds" isn't marketing copy — it's the job this product does inside the fleet every day.
Read the full journeyDesigned for these teams



Primary: Backend developers and platform engineers at 10–100 person SaaS companies who maintain reporting features; Secondary: Growth analysts and operations managers at 20–200 person companies who run weekly reporting in spreadsheets and need to eliminate manual chart formatting; Tertiary: Digital agencies and analytics consultancies building client dashboards
Put to work
Weekly email reports with branded charts — developers replace watermarked images with AI-annotated, permanently persistent chart URLs
CloviTek workspace digest automation — growth teams send performance dashboards to CloviTek workspace daily/weekly without a BI platform
CloviTek knowledge base analytics pages — analysts embed live chart URLs in CloviTek knowledge base databases; charts update on schedule without re-exporting from spreadsheets
Multi-service consistent branding — SaaS companies with 3+ products unify chart styling by calling one CloviCharts API instead of maintaining separate Chart.js configurations
PDF report generation — financial reports, cohort analyses, and performance summaries include charts via stable CDN URLs
Internal dashboards (CloviTek use case) — CloviCRM pipeline health, SpectroScience student engagement, CloviCrypto portfolio performance — all rendered server-side with zero chart library in each plugin
Where it's going
Phase 1 (Jun–Jul 2026): MVP hardening — CloviTek schema, API key auth, CloviTek SSO, per-user quota, CloviPay billing, CloviTek cloud storage persistence, OpenAPI spec, security fixes
Phase 2 (Aug–Sep 2026): Growth features — ECharts integration (heatmap/waterfall/sankey/gauge), interactive iframe embeds, custom theme UI, AppSumo lifetime deal, webhook notifications, JWT signed tokens
Phase 3 (Oct–Dec 2026): Scale features — team workspaces with RBAC (5 seats), no-code automation platforms integrations, npm package, CMS block, CloviTek knowledge base API integration, CloviTek workspace app for chart delivery
Phase 4 (2027+): Platform play — OEM white-label model for external SaaS products, persistent data connectors with scheduled refresh (lightweight embedded BI), multi-source data integration
Plans & tiers
Pricing is fetched live from our billing system and reflects current published rates.
Start building with CloviCharts today
CloviCharts ships production-ready with your branding, domain, and billing wired up in under 24 hours. No infrastructure work required.